SWTChart
SWTChart是一个基于SWT的轻量级(包括源码整个SWTChart jar文件只有140KB)图表制作组件。它拥有以下基本功能:
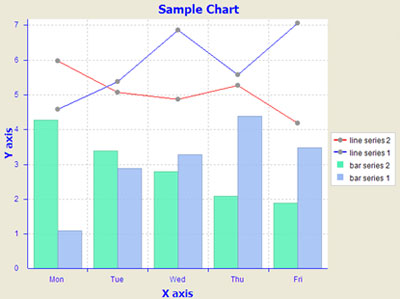
* line chart
* scatter chart
* stack chart
* log scale
* category axis
* multiple axes
* bar chart
* area chart
* step chart
* axis orientation
* series label
* ...
SWTChart is a chart component which has following basic functionalities.
Based on SWT
SWTChart is based on SWT. If you are planning to implement your application with Swing/AWT, maybe you should choose another chart component. However, if you implement Eclipse plug-ins or SWT-based standalone applications, SWTChart would be one of the candidates to choose.
High Extensibility
All of widgets in SWTChart are composed of SWT, so that you can easily hock listeners to widgets, and also you can easily extend the functionality without expertise of AWT. As an example extending SWTChart, SWTChart Extension is bundled together with SWTChart, so that you may get some idea how to extend it. SWTChart Extension has an ability to zoom with mouse or to scroll with arrow keys. Of course, instead of extending with public API, you can directly customize SWTChart itself, since SWTChart is open source software.
High Performance
SWTChart provides an ability to handle large data size of series. Even if showing 1,000,000 data points, repainting or resizing chart panel doesn't take long time. The internal algorithm is not to simply sample the data with a certain interval but to thin out only the data which doesn't make sense to show in current screen resolution. Therefore, even if there are prominent peaks in large data points, the peaks won't be lost in the screen.
Light Weight
SWTChart has minimum basic functionalities. SWTChart doesn't have any dependencies other than SWT, and even JFace is not required. The file size of deliverable (SWTChart jar file) is around 140KB including source code. This would make it easy for you to distribute your application.


网友留言/评论
我要留言/评论
相关开源项目
收录时间:2010-11-25 13:43:53
收录时间:2011-06-24 09:36:07