Perf4J
Perf4J是一个用于记录、监测和分析Java应用程序性能的开源工具。如同log4j类似于System.out.println()一样,Perf4J类似于System.currentTimeMillis()。
Perf4J提供的功能包括: 用于计时的简单的停止观测(stop watch)机制。
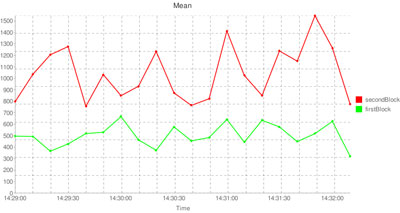
1. 用于解析日志文件的命令行工具,可以生成聚合统计和性能图表
2. 易于与常见的日志框架和facades集成:log4j、java.util.logging、Apache Commons Logging及SLF4J。
3. 运行时自定义log4j appender 产生统计数据和图表
4. 可以将性能统计暴露为JMX属性,当统计超出指定极限时发送通知。
5. 用于展现Web应用性能图表的Servlet。
6. 提供了@Profiled注解和一套客户化的方面(aspect),在处理AOP框架如AspectJ或Spring AOP时可以灵活插入计时语句。
Perf4J is a set of utilities for calculating and displaying perfomance statistics for Java code. For developers who are familiar with logging frameworks such as log4j or java.util.logging, an analogy helps to describe Perf4J:
Perf4J is to System.currentTimeMillis() as log4j is to System.out.println()
How is this relevant to Perf4J? Consider that before good logging frameworks were widely available, developers new to Java would often print debugging statements using System.out.println(). Later they would discover they wanted log statements to go to a dedicated file, perhaps a log file that was rolled daily. Then they would discover they wanted finer control of which log statements would be written, and they wanted it to be possible to only have some log statements written in some environments without changing any code. Thus, the full set of features that log4j provides comes out of the original desire to have a "better" System.out.println() for logging statements.
Similarly, when new Java developers discover that they need to time specified blocks of code for performance logging and monitoring reasons, they often do something like this:
long start = System.currentTimeMillis();
// execute the block of code to be timed
System.out.println("ms for block n was: " + (System.currentTimeMillis() - start));
Later on, though, these developers find they want more information, such as aggregated performance statistics like mean, minimum, maximum, standard deviation and transactions per second over a set time span. They would like graphs of these values in real time to detect problems on a running server, or they would like to expose performance metrics through JMX. In addition, they want their timing statements to work with the common logging frameworks like log4j.
Perf4J provides these features and more:
* A simple stop watch mechanism for succinct timing statements.
* A command line tool for parsing log files that generates aggregated statistics and performance graphs.
* Easy integration with the most common logging frameworks and facades: log4j, java.util.logging, Apache Commons Logging and SLF4J.
* Custom log4j appenders to generate statistics and graphs in a running application (custom java.util.logging handlers coming soon).
* The ability to expose performance statistics as JMX attributes, and to send notifications when statistics exceed specified thresholds.
* A servlet for exposing performance graphs in a web application.
* A Profiled annotation and a set of custom aspects that allow unobstrusive timing statements when coupled with an AOP framework such as AspectJ or Spring AOP.
* An extensible architecture.


